Market Snapshots
Important:
- A free account is required to generate and download EOD Historical data.
- The download box will appear after login.
Market Index provides snapshots of the Australian share market going back 20 years.
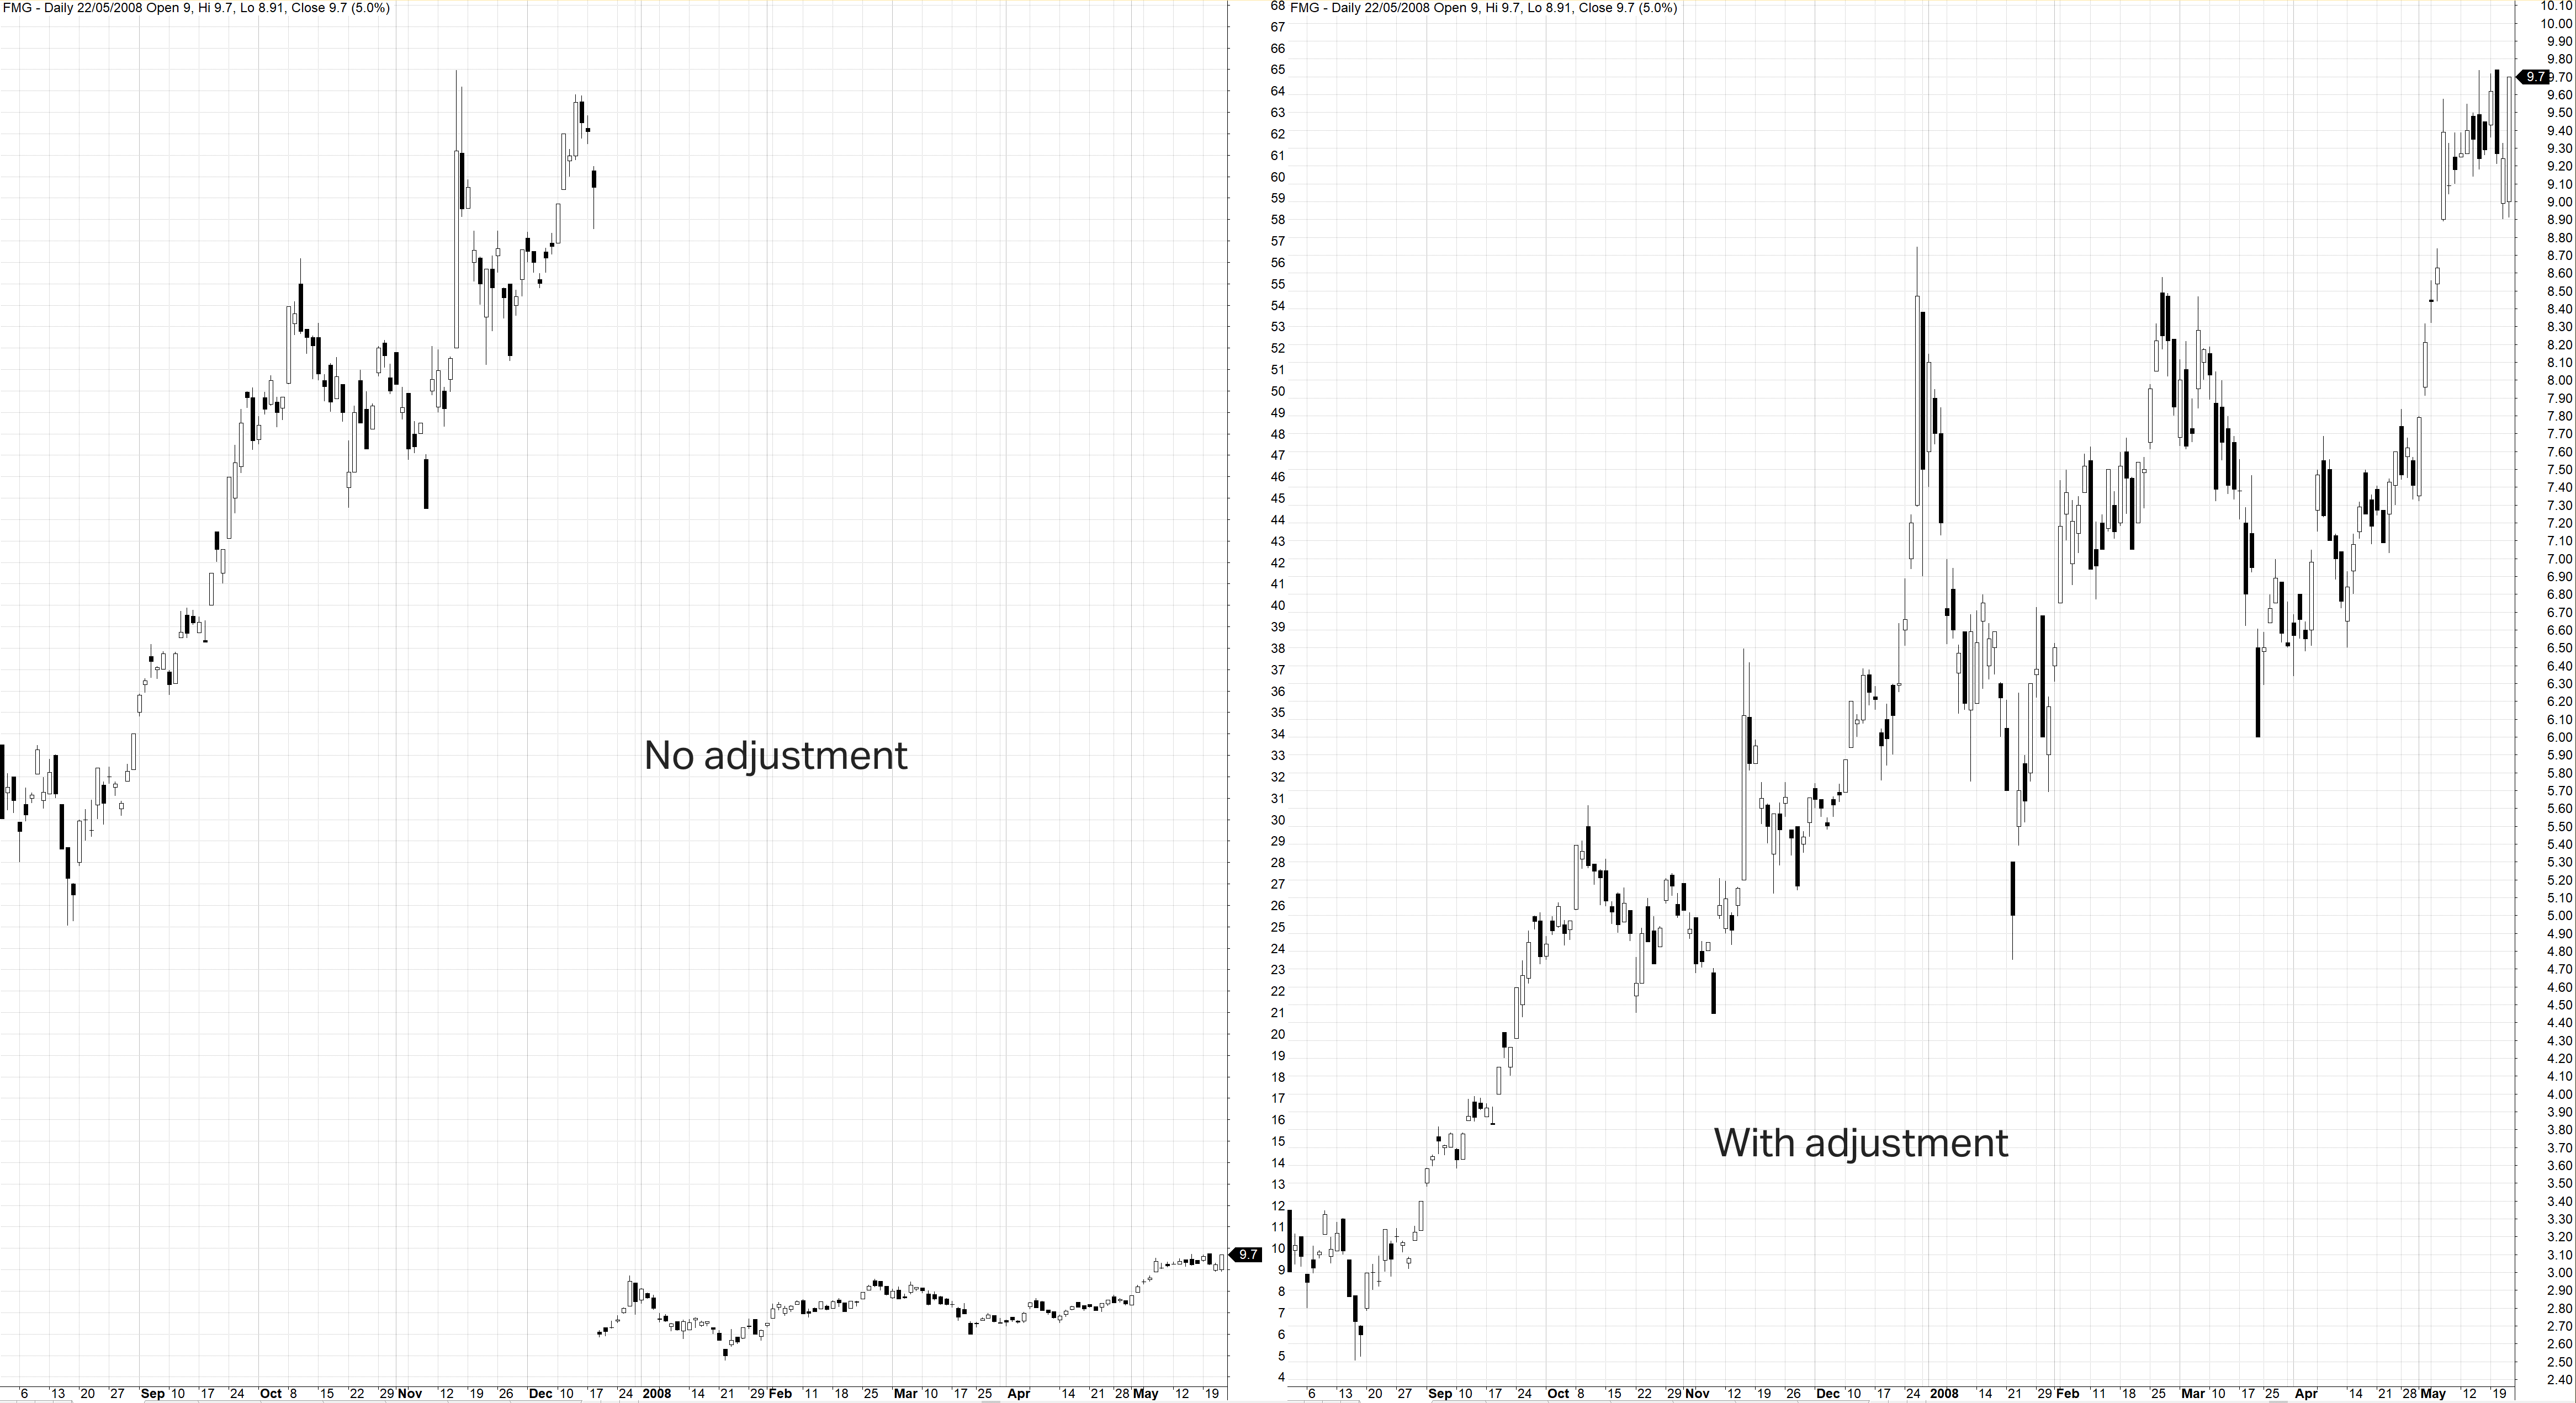
The snapshots are “as traded on the day”. That means price and volume data are not back-adjusted to factor in corporate actions like splits, consolidations, mergers, and ticker changes.
Why not just look at a company’s chart?
Stock charts (including on Market Index) are adjusted for corporate actions to prevent large drops and rises in the chart. This allows technical indicators and trend lines to be accurately applied, and the historical market value of a company to be plotted correctly.
Unfortunately, this back-adjusting confuses many people as the stock price on a chart is often different to the actual price traded on that day.
For example:
Fortescue Metals Group Ltd (FMG) had a 10 for 1 stock split in 2007 which dropped its share price from around $60 to $6. This is because the total number of shares on issue was multiplied by 10. If you held 550 stocks before the split, you'd hold 5,500 after the split. In this scenario, all prices prior to the split date are divided by 10.
See the picture of FMG's chart before and after the adjustment.
Important Information
- Market Index can only offer snapshots on a day-to-day basis due to licensing restrictions.
- We cannot provide bulk downloads or intraday data.
- Snapshots are for personal use only.
ASX Snapshots
An account is required to view historical market snapshots. Create a free account or log in here.
